Monitoring Looker
Whether your Looker instance is hosted by Looker/Google or you're hosting it on-premises, it's a good idea to set up some monitoring so you have a good idea of how Looker is behaving at all times.
It's very likely you'll have some period which is always particularly busy - commonly this is a Monday morning, since your users will naturally schedule their reports to run then to cover the previous week, and people will tend to start their working week by opening up their important dashboards and looks.
Endpoints
Looker has a couple of endpoints which are really useful for monitoring.
https://youinstance.cloud.looker.com/alive
This is a simple HTTP endpoint which will return an HTTP 200 OK response (assuming Looker is indeed alive!). This is the most basic check and won't tell you anything about the Looker application itself. No page is rendered so if you open this in a browser you'll need to open the browser's developer tools to check the HTTP response code.
https://youinstance.cloud.looker.com/availability
With this one, Looker actually renders a page which displays 'Looker is up' if indeed that is the case. Since a page is rendered you can expect the overall response time to be slightly longer than the /alive endpoint. This one is handy to open in your browser for a quick check on Looker.
It's worth noting that being logged in or not can make a difference here - some types of problem could affect logged in users/the display of this page, but a logged out user might still see the page with no problems.
https://youinstance.cloud.looker.com/version
This endpoint simply returns a string representing the version number of your Looker instance. This is a quick way to see the version and you could even monitor it to know exactly when your instance has been updated.
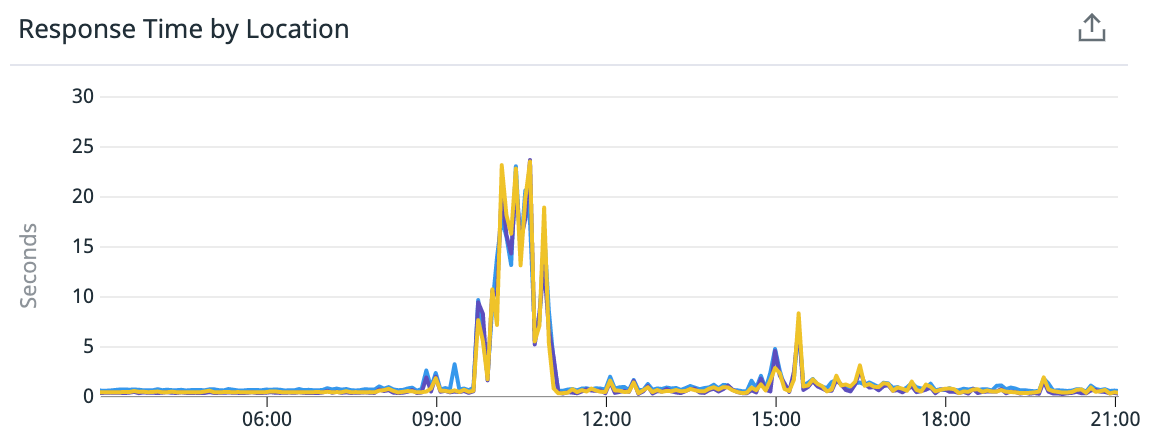
Plugging these endpoints into a monitoring tool such as DataDog can give you some nice graphs of Looker's performance over time, and highlight any times when it's under particular load, as well as giving you the option to be alerted in case of a problem.
JMX
The Looker application runs on the Java virtual machine, and if you're hosting Looker on your own infrastructure, you can use JMX (Java Management Extensions) for detailed monitoring of the Java VM. This is likely some that your platform/devops team will handle, and detailed instructions can be found in Looker's documentation.
These options are only about monitoring your Looker instance as a whole. For more in-depth information about queries, dashboards etc, you'll want to use Looker's built-in system activity data and dashboards to get an idea about performance of content and Explores in Looker so you can optimise and improve the experience for your users.


